Translate

Showing posts with label Spatial Blueprint Read. Show all posts

Sunday, February 9, 2020

In Its First Decades, The United States Nurtured Schoolgirl Mapmakers

 NOVEMBER 28, 2018

Atlas obscura


The first “schoolgirl map” that caught historian Susan Schulten’s attention was made in 1823 by Frances Henshaw, a student at one of the best schools for girls in the young United States. The map came from Henshaw’s Book of Penmanship, which included details about geography and astronomy—comets, meridians, horizons, polar circles, and climate zones. The young woman’s drawing encompassed 19 states, copied from Carey’s American Pocket Atlas, from 1805, and Arrowsmith and Lewis’ Atlas, from 1812.
"A Map of the United States," from Catharine M. Cook's Book of Penmanship, made in Windsor, Vermont, in 1818. COURTESY OSHER MAP LIBRARY, UNIVERSITY OF SOUTHERN MAINE

Schulten studies 19th-century American cartography at the University of Denver, and she was excited to find a map so charming and pretty, with a connection to the history of education for women. The more she started looking for maps like it, the more she found, until she had collected around 150 maps made by American schoolchildren in the early 1800s. “I started looking at them because I was captivated,” she says. “They jump at you … someone put so much time into this.”
And soon she realized that these weren’t just lovely images. “I realized there were some patterns,” she says. “Once I started seeing patterns, I realized that this was a hidden part of American education that you wouldn’t know about if it weren’t for the maps.”
"A Map of the United States," from Catharine M. Cook's Book of Penmanship, made in Windsor, Vermont, in 1818. COURTESY OSHER MAP LIBRARY, UNIVERSITY OF SOUTHERN MAINE

Before this time in American history, any education that girls received happened at home, through lessons from their families or, for the most well-off, with private tutors. But in the decades after the American Revolution, educators opened hundreds of small academies for young women. Each school had a curriculum tailored for girls, focused on subjects considered appropriate at the time. Geography was a safe subject, and one popular exercise had girls tracing or drawing maps.
The maps that Schulten was finding weren’t practical tools, though. Many lacked indications of scale, for instance. Instead, they showed off the mapmaker’s artistic skill and were opportunities to practice penmanship. The names of cities, rivers, and states, for example, might all be done in different lettering styles. Some students took up the task of making detailed maps—which could be tedious and downright boring—as exercises in mental discipline. Some of the most influential educators at the time, including Emma Willard, a pioneer in education for women and another subject of Schulten’s work, saw maps as powerful tools to aid memorization and analysis.
Hannah Comstock’s “Map of the World,” made in 1815. BOSTON RARE MAPS AND JAMES E. ARSENAULT & COMPANY

One of the more fascinating aspects of these maps—made mostly by young women, but occasionally by young men—is how they reflect a growing sense of American identity. Often students created maps of the entire globe or of their home states, but after the War of 1812, which the United States saw as a victory, there was a spike in maps of the country, Schulten found.
Thinking of the disparate states as a political whole—the United States of America—was novel so early in the nation’s history. “For me the really powerful thing is that, after the Revolution, you have to cultivate an American identity. There’s nothing natural about it,” Schulten says. “It has to be learned. This fits in that sense. Even from a relatively young age, of 12 or 13, you can have people think about the larger political body that they’re part of.”

The female academies had proliferated quickly, but their teachers had no standard curriculum to draw on. Young women took the lessons they’d learned in school, traveled to a new place, and started passing it on. Because the maps often are linked to a certain school, it’s possible to see, when enough are collected together, how the practice of mapmaking spread.
“It shows a network of young women becoming teachers,” says Schulten. “For me, it was like a window onto a past that was otherwise unseen.” The maps are also unusual artifacts in that they reveal part of history that’s not documented elsewhere. “I had never had that experience,” she says. “Part of what blew me away is that here’s an instance where a map isn’t just illustration of something we know. It’s showing something new.” The maps are evidence of a system of pedagogy that wasn’t recorded in other ways—how women shaped and traded knowledge, while passing along new notions of nationhood.
Many of the schools were open for just a few years—even just a few months—before closing their doors, but they were part of a movement in which less-wealthy women began to gain access to education. “They were schools that have otherwise disappeared from historical memory,” says Schulten. But the maps that students made are documents of their existence, the emerging identity of a young country, and a nascent transformation in the lives of women.
Source link below. You can also view more images of maps on the link. 

Sunday, March 17, 2019

Shawnadithit

In the 1970s, a map librarian named Alice Hudson at the New York Public Library became curious about the women who came before her.
"I thought I might find 10," she said in an interview about her initial thoughts before she began her research of female cartographers. By the late '90s, she said she found more than a thousand names of women who had drawn, published, printed, engraved, sold, or traded maps before 1900.
Below is information on one female cartographer, Shawnadithit.  

Excerpt from
Shawnadithit grew anxious waiting for her uncle, Longnon, to return to camp at the junction of Badger Brook and the Exploits River, deep in the wilds of Newfoundland. The little band of Beothuk was starving and Longnon had set out with his daughter in desperation to collect shellfish at Badger Bay. Some days later, Shawnadithit left camp with her mother and sister to search for them. They found them dead at Badger Bay, shot by the local fishermen.

In spring 1823 Shawnadithit, her sister and mother were taken captive by the furrier William Cull. The authorities decided to return them to their people as emissaries of peace, loaded them with presents, and left them at the mouth of Charles Brook with a small boat.
All three women were sick with the consumption that was a plague among the Beothuk. Shawnadithit's sister died and soon it was obvious that her mother was dying too. Shawnadithit took her mother to a sandy point by the waters of Red Indian Lake, held her in her arms and sang her people's last lament. She sewed her body into a blanket of birch bark, buried her and set out alone for the coast, stumbling out at Notre Dame Bay. She knew now that she was the last of her people.

Map by Shanawdithit

In 1500 the Portuguese explorer Gaspar Corte-Real had the first encounter with the Beothuk, capturing 57 of them to sell as slaves. The Beothuks' habit of covering themselves with red ochre gained them the name "Red Indians,” which was later applied to all the tribes of North America.
In other parts of Atlantic Canada, the French and English needed First Nations partners in order to carry on the fur trade. In Newfoundland the Europeans were there to fish, which put them into direct conflict with the Beothuk. Oblivious to the need for the salmon to spawn upriver, the fishermen erected weirs across the mouths of the rivers. Beothuk caught raiding the weirs were killed.
Cut off from the coast and from the salmon, forced to hide in the interior where white trappers exterminated the beaver, marten and sable, and decimated by disease, the Beothuk population dwindled to a mere few hundred by the mid 18th century.
In 1792 Magistrate John Bland carried out an investigation of several killings around Twillingate, where it was reported that Beothuk were "shot down like deer.” Bland predicted accurately that the English, like the Spanish before them, "will have affixed to their character the indelible reproach of having extirpated a whole race of people.”
Shawnadithit was a witness to the final encounters between her dwindling people and the expeditions sent out to capture Beothuks alive. She saw the capture of Demasduit and the brave attempt of her husband Nonosbawsut to rescue her in March 1819. Enraged at his wife's kidnap, Nonosbawsut charged at the intruders until they killed him.
Shawnadithit lived for a while in obscurity as a domestic at Exploits. Though she was clearly intelligent, there was no attempt to encourage her to speak of her experiences. In St John's there was a growing concern that all knowledge of the Beothuk would be lost. William Epps Cormack, the peripatetic explorer and humanitarian, brought Shawnadithit to St. John's under the auspices of the Boethick Institution. She learned English and showed a gift for drawing. Her maps, drawings and stories are the last records of the language and customs of her doomed people.
When Cormack left Newfoundland, Shawnadithit responded to his kindness by giving him a lock of her hair and two stones from Red Indian Lake, tiny symbols of all that remained of the great territory in which the Beothuk once prospered. She died shortly after, on June 6, 1829, of tuberculosis, "the cough demon” that had victimized so many of her people.
The story of the Beothuk is surely one of the saddest chapters in Canadian history, made personal and melancholy by the story of Shawnadithit herself. As Cormack wrote, "the British have trespassed in this country and have become a blight and a scourge to a portion of the human race; under their power a defenceless and once independent proud tribe of men have been extirpated from the face of the earth.”

Excerpt from 

The Forgotten History of Female Mapmakers


In her 20s, hungry and alone, Shanawdithit found work as a servant in a white settlement on the island, where she learned to read and write in English. She became the subject of anthropological interest for the explorer William Cormack, who was working to found a center devoted to Beothuk history. Under his watch, in 1829 Shanawdithit created five extraordinary narrative maps in which she compressed and plotted her memories of her tribe’s movements and collisions with the settlers some 18 years earlier. The rivers and lakes that appear in her maps are drawn with incredible geographical accuracy, according to the explorer James P. Howley, who wrote a 1915 history of her tribe, The Beothucks or Red Indians. The Beothuk people and all that pertained to them are marked in red, and the British in black.


In the map pictured above, Shanawdithit depicted the capture of her aunt, Demasduit, whose English name was “Mary March.” Howley describes this map:
This sketch is labelled “The taking of Mary March on the North side of the lake.” And in another place “Two different scenes and times.” It depicts, on a large scale, the North East Arm of Red Indian Lake. On the south side is again seen [Captain David] Buchan’s party, marching in single file towards the outflowing river, with the accompanying Indians in red. Also the four Indians approaching to kill the two marines.
… A third red line extends out on the lake upon which four figures are shown. In front of the wigwams on the ice are grouped half a dozen black, with one red figure in their midst. Standing near this group is a single red figure apparently of a large man, as if in the act of haranguing the group, while a little to one side is another red figure lying prone on the ice. It is almost needless to say this represents the furriers taking Mary March, her husband coming back to the rescue, and his dead body, after being shot, lying on the ice.
Other native North Americans drew maps that depicted their encounters with European settlers, though very few have survived the centuries. Shanawdithit’s maps, and the stories she told Cormack, are among the last accounts of her people’s language, customs, and beliefs—and have become symbolic of a tragic chapter in Canadian history.


Seeing Is Believing: How Marie Tharp Changed Geology Forever

smithsonian.com 

There’s no denying that maps can change the way we think about the world. But what about the way we think about what’s underneath? That was the case in 1953, when a young geologist named Marie Tharp made a map that vindicated the controversial theory of plate tectonics. But Tharp’s discovery of the 10,000-mile-long Mid-Atlantic Ridge*—a find that showed that the sea floor was spreading—was initially dismissed as “girl talk.”


Tharp, who was born in 1920, came of age during a time that was suspicious of women who chose to make science their life’s work. In retrospect, it makes plenty of sense that the daughter of a soil surveyor for the U.S. Department of Agriculture would inherit a taste for both geology and cartography. But given the scant number of women in geology at the time—women obtained fewer than 4 percent of all earth sciences doctorates between 1920 and 1970—it’s surprising that Tharp was able to pursue her passion.
Like many other women scientists of her day, Tharp found an unexpected opportunity in the form of a world war. During the 1940s, Tharp was able to pursue an accelerated master’s degree in geology due to the dearth of young men in the earth sciences department at the University of Michigan.
Tharp knew that geology was a long shot. Women were not recognized by some professional societies and had long been discouraged from working in the field. But field studies are at the core, as it were, of much geology research. Tharp’s mentors knew it would be an uphill battle; one encouraged her to work on her drafting skills to increase her chances of getting any kind of job in the earth sciences after the war ended. At the time, it was good advice—women who refused to perform the deskbound of analyzing and drawing out results collected by men rarely found work in the sciences. Luckily for Tharp, the seemingly low-level drafting skills she honed would later lead to the biggest discovery of her career.
Armed with those skills and another master’s degree in mathematics, Tharp began working at Columbia University’s Lamont Geological Laboratory after a brief stint in the petroleum industry. Called the Lamont-Doherty Earth Observatory today, the lab was ground zero for cutting-edge earth sciences research.

It was a heady time for the field, in large part because it was so untapped. Meteorologist Alfred Wegener, fueled in part by observations of how South America and Africa had coastlines that looked like they went together and the existence of similar fossils in extremely different parts of the world, had proposed the concept of continental drift back in the nineteen-teens. But his theory was largely dismissed. At the time, there was no way to prove that a massive supercontinent had ever existed, and the idea that continents could move through the ocean floor seemed preposterous.
Besides, subsurface geology—the study of rock and soil beneath Earth’s surface—didn’t really exist yet. Nor did scientists have ways to map the ocean floor, which they assumed was drab and flat.
Lamont lab founder Maurice "Doc" Ewing was unwilling to tolerate that status quo—or to keep geology research trapped inside cluttered offices and museums. He pushed his lab mates toward the ocean, insisting on the use of physics and chemistry to study the phenomena at the bottom of the sea. Sonar had come into its own during the war, further advancing the nascent field.
Navy regulations meant Tharp couldn't go out on the research vessels that Ewing and her other colleagues chartered. Even if she had, they would not have been hospitable places for women (one of the deep sea cameras Ewing took on his journeys was affectionately dubbed “The Pyrex Penis” due to its phallic appearance). Instead, she stuck to her drafting table, collaborating with geologist Bruce Heezen on a map of the ocean floor.
For years, Heezen collected the data while Tharp crunched the numbers and charted them out. It was thankless work in a time before computers; Tharp had to comb through an enormous pile of sonar soundings and plot out her measurements by hand. Still, she found inspiration in the very mystery of the task. “The whole world was spread out before me,” she recalled in a 1999 essay about the Lamont-Doherty Earth Observatory. “I had a blank canvas to fill with extraordinary possibilities ... It was a once-in-a-lifetime—a once-in-the-history-of-the-world—opportunity for anyone, but especially for a woman in the 1940s.”
Then, something unexpected showed up on Tharp’s canvas: a huge valley in the middle of the gigantic ocean ridge she was mapping. It was so deep that she kept re-checking her calculations. If it was what she thought it was, she would have evidence of a rift valley inside a ridge at the bottom of the North Atlantic Ocean. That, in turn, would be evidence that the huge chain of mountains she was mapping was a place where the oceanic crust was spreading apart.
“When I showed what I found to Bruce,” she recalled, “he groaned and said ‘It cannot be. It looks too much like continental drift.’ … Bruce initially dismissed my interpretation of the profiles as ‘girl talk’.” It took almost a year for Heezen to believe her, despite a growing amount of evidence and her meticulous checking and re-checking of her work. He only changed his mind when evidence of earthquakes beneath the rift valley she had found was discovered—and when it became clear that the rift extended up and down the entire Atlantic. Today, it is considered Earth’s largest physical feature.
When Heezen—who published the work and took credit for it—announced his findings in 1956, it was no less than a seismic event in geology. But Tharp, like many other women scientists of her day, was shunted to the background.
Source link:

Want to know more? Read the book. 


Cyanotype (Blueprint)

The blueprint process is essentially the cyanotype process developed by the British astronomer and photographer Sir John Herschel in 1842.

Read about Sir John Herschel in the link below:
http://www.newworldencyclopedia.org/entry/John_Herschel


Portrait of Sir John Herschel (1792 - 1871)
by his daughter Margaret Louisa Herschel (1834 - 1881)


A bit of background info:

The Cyanotype Process

The cyanotype process was one of the first non-silver technologies used to create photographic images. Originated in the 1840's, it was not utilized in mainstream photography and was adopted as a copying technique, becoming known by the term "blueprint", with its blue background reproductions of large architectural and mechanical drawings.

Variations of the original formula involve different ratios of the following chemicals:To begin the process, two solutions are prepared for the two-part sensitizing process. Material sensitized with the solution is then printed by ultraviolet light.

(1) Potassium ferricyanide and (2) Ferric ammonium citrate(green). Too much potassium ferricyanide in the solution will lower printing speed; too little may cause the blue color to bleed into the lighter areas. Basically equal volumes of the two solutions are used.
Below are several more commonly used cyanotype recipes. The chemical names are linked to prices, information, and online ordering. Use appropriate safety measures throughout the process.
Solutions may be stored for several months in amber glass bottles.


The History of Blueprints

How does a building go from a designer’s imagination to a three-dimensional reality? How does a complicated structure with so many parts, materials and workers come together? The answer is in the history of blueprints.
In today’s construction industry, before anything is built, it’s dreamed, drawn and planned in the form of blueprints. These documents are truly the foundation of any construction project but they have been around for some time now. So, where did blueprints originate from and where are they evolving today? From the start of medieval drawings to the digital documentation sweeping today’s construction industry, below we’ll explore how the history of blueprints has evolved over centuries as well as where the future of these critical design documents is going.

Early Beginnings in Medieval Drawings

Before blueprints evolved into their modern form, look and purpose, drawings from the medieval times appear to be their earliest formations. The Plan of St. Gall, is one of the oldest known surviving architectural plans. Some historians consider this 9th century drawing as the very beginning of the history of blueprints. Mysteriously, the monastery depicted in the drawing was never actually built. So, a group in Germany is using this drawing, along with period tools and techniques, to learn more about architectural history. You can view a detailed diagram and models based on the plan here.

Renaissance Drawings

The documents that emerged from the Renaissance era look more like modern blueprints than the ones from the Medieval Period. In fact, architect and engineer Filippo Brunelleschi used the camera obscura to copy architectural details from the classical ruins that inspired his work. Today, Brunelleschi is considered to be the father the modern history of blueprints. The architects of the Renaissance period brought architectural drawing as we know it into existence, precisely and accurately reproducing the detail of a structure via the tools of scale and perspective. At the time, this was a highly time intensive and specialized job, often done by dedicated draftsmen.


Early Modern Drawings by Draftsmen

Until the mid 19th century, architects relied on skilled draftsmen to faithfully copy their drawings for distribution. However, enter the era of specialized architectural tools and draftsmen were then able to produce drawings more accurately and more productively. Myriad specialized instruments used for copying lines, curves, and arcs, from the French curve to the set square and the bow compass, were the tools of the draftsman’s trade.


How the Blueprint Became Blue

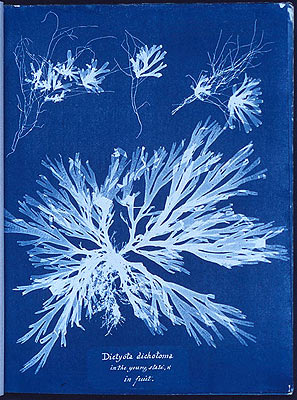
Ever wondered where the “blue” came from in blueprints? These documents actually obtained their trademark blue in 1842 when John Herschel discovered the cyanotype process. Artists and scientists quickly adopted this new way to reproduce notes, efficiently and at a lower cost than previous methods available. Preserving the silhouette of leaves, ferns and other botanical samples were easier than ever.
Using the cyanotype process, an architectural drawing was made on a semi-transparent paper, then weighted down on top of a sheet of paper or cloth that was coated with a photosensitive chemical mixture of potassium ferricyanide and ferric ammonium citrate. In the final stages, the document was exposed to light. The exposed parts of the drawing (the background) became blue, while the drawing lines blocked the coated paper from exposure and remained white.

The Evolution of Midcentury Design Drawings

While draftsmen still copied drawings into the modern period, a variety of chemical and mechanical processes for reproducing architectural drawings developed out of the 19th and 20th centuries. The diazo process replaced cyanotype as the dominant printing process for most of the 20th century. Instead of a blue sheet with white lines, the process produced a white print with blue lines, and was also known as a “blueline” drawing or “whiteprint”. Diazotypes used a similar chemical process to the cyanotype. A drawing was made on mylar or another translucent surface, placed on chemically coated paper, and exposed. The American Institute for Conservation lists 14 different types of processes for reproducing drawings they discovered while conserving the New York Botanical Garden Library’s collection of drawings. This list is a basically a summary of the history of blueprints in the midcentury:
  • Aniline prints
  • Cyanotypes
  • Diazotypes
  • Electrostatic prints
  • Ferrogallic prints
  • Gel-lithographs
  • Hectographs, (handmade)
  • Pellet prints
  • Photostats
  • Sepia prints
  • Silver halide prints
  • Stencil duplicating (mimeographs)
  • Spirit duplicating (hectographs, machine made)
  • Van Dyke prints


CAD Drawings

The end of the 20th century saw the development of computer-aided drafting (CAD) technology and large-format printing processes that made the reproduction of multiple accurate copies of the architect’s original design easier than ever. Although producing documents was never easier, along with the ability to print to paper with ease came a document management nightmare. Now, offices were filled with massive reels of blueprints. On a paper-based system, each time a change in a construction plan was implemented, outdated documents need to be replaced. As a result, a huge drain on manpower and resources is created, not to mention the inevitable rework needed when an outdated set slips through the cracks.

Entering the Digital Age in the History of Blueprints with Digitalization

Today, the blueprint of the future is digitally based. Although the construction industry is still widely paper-based, this is changing quickly. Now, with cloud-based document control solutions, digital drawing files are distributed instantaneously from office to the field. Users can upload plans to construction cloud software solutions, like PlanGrid, and automatically sync to all the individual tablets of project collaborators. Software that includes features like automatic version control replaces what used to take hours of project engineer’s time. Now, construction workers no longer waste time manually unbinding reams of blueprints or physically leafing-in revisions sheet by sheet. All project members have benefited from digital blueprint management systems, from the architects and design teams to the field workers on the ground. Chasing down foremen and superintendents to hand them a paper copy of the latest updates is rapidly becoming a thing of the past.


Text and image source link below:

Sarah Sze, American, b. 1969


Artist Sarah Sze shares the process behind her immersive installation Blueprint for a Landscape (2016) at the Second Avenue Subway’s 96th Street station. This text is excerpted from an interview conducted with the artist in February 2016, just prior to the installation of the work.


Read Artist Interview: